Market Outlook
June 8, 2017
Market Cues
Domestic Indices
Chg (%)
(Pts)
(Close)
Indian markets are likely to open flat tracking the SGX Nifty and Global markets.
BSE Sensex
0.3
81
31,271
U.S. markets closed higher on Wednesday as investors hoped the testimony from
Nifty
0.3
27
9,664
former FBI chief James Comey will be less damaging to President Donald Trump
Mid Cap
0.5
68
14,801
than previously feared.
Small Cap
0.8
115
15,426
European markets ended Wednesday's session with mixed results. Traders were in a
Bankex
0.7
193
26,722
cautious mood ahead of a trio of potentially market moving events tomorrow. U.K.
voters will head to the polls on Thursday in a closely watched election, while the
Global Indices
Chg (%)
(Pts)
(Close)
European Central Bank is scheduled to make its latest monetary policy
announcement. Former FBI Director James Comey will also begin his testimony
Dow Jones
0.2
37
21,174
before the Senate Intelligence Committee on Thursday.
Nasdaq
0.4
22
6,297
FTSE
(0.6)
(46)
7,479
Indian market eked out modest gains to hit fresh record closing highs on
Nikkei
0.0
5
19,985
Wednesday after the Reserve Bank of India (RBI) kept repo rate unchanged at
6.25%, as widely expected, but cut statutory liquidity ratio by 50 basis points to 20
Hang Seng
(0.1)
(23)
25,974
percent, a move that will help infuse more liquidity into the banking system and
Shanghai Com
1.2
38
3,140
pave the way for a reduction in bank lending rates going forward.
Advances / Declines
BSE
NSE
News Analysis
Advances
1,471
962
RBI keeps rates unchanged
Cadilla gets US FDA approval for Mesalamine tablets…
Declines
1,204
691
Detailed analysis on Pg2
Unchanged
145
102
Investor’s Ready Reckoner
Volumes (` Cr)
Key Domestic & Global Indicators
BSE
3,517
Stock Watch: Latest investment recommendations on 150+ stocks
Refer Pg5 onwards
NSE
23,043
Top Picks
#Net Inflows (` Cr)
Net
Mtd
Ytd
CMP
Target
Upside
Company
Sector
Rating
(`)
(`)
(%)
FII
(3,134)
(3,583)
48,386
Blue Star
Capital Goods
Buy
630
760
20.6
MFs
449
8,960
29,642
Dewan Housing Fin. Financials
Buy
431
520
20.5
Mahindra Lifespace Real Estate
Buy
420
522
24.3
Top Gainers
Price (`)
Chg (%)
Navkar Corporation Others
Buy
219
265
21.3
KEI Industries
Capital Goods
Buy
216
258
19.4
Iifl
607
10.2
More Top Picks on Pg3
Cadilahc
537
9.6
Edelweiss
197
6.3
Key Upcoming Events
Previous
Consensus
Shriramcit
2,455
5.2
Date
Region
Event Description
Reading
Expectations
Ibrealest
171
4.1
Jun 08, 2017 India
RBI Cash Reserve ratio
4.00
4.00
Jun 08, 2017 Euro Zone Euro-Zone GDP s.a. (QoQ)
0.50
0.50
Top Losers
Price (`)
Chg (%)
Jun 08, 2017 UK
Industrial Production (YoY)
1.40
(0.30)
Jun 08, 2017 China
Exports YoY%
8.00
7.20
Hexaware
245
(5.2)
Jun 09, 2017 Euro Zone ECB announces interest rates
-
-
Adanitrans
120
(5.0)
Jun 09, 2017 China
Consumer Price Index (YoY)
1.20
1.50
Videoind
32
(5.0)
More Events on Pg4
Rcom
19
(3.7)
Unitdspr
2,351
(3.2)
#as on 7th June, 2017
Market Outlook
June 8, 2017
News Analysis
RBI keeps rates unchanged
The RBI has left the key rates unchanged in its 2nd Bi-Monthly monetary policy.
While the MPC has kept a neutral stance on the monetary policy, the under tone
was less hawkish; the lowering of inflation projections indicates that there is still a
room for rate cut in the coming policy meetings. While the REPO rate was kept
unchanged, on a positive side the RBI has cut the SLR requirement by 50 bps which
should allow more liquidity at the end of banks. In the 1st Bi-Monthly monetary
policy in April 2017, the RBI had indicated that inflation could remain at 4.5% in
1HFY18 and gradually rise to 5% in 2HFY18. However, the CPI inflation for April
2017 saw a sharp drop to 2.99% vs. 3.89% in March 2017, this seems to have
resulted in the RBI projecting a lower inflation going ahead.
On the growth front, the RBI has revised its GVA projections by 10 bps to 7.3% for
FY18; however, it has maintained that the process of remonetisation will help in
picking up the discretionary spending fuelling the growth. In another key
announcement, the RBI has reduced the risk weightage on home loans above Rs
75 lakhs to 50% from earlier 75% and in addition to this, the standard asset
provisioning on home loans has been reduced to 25 bps from 40 bps. We had
been positive on the housing finance space in India and the current measure of
lower risk weightage and lower provisioning requirement should bring in higher
growth for the sector in the quarters to come.
Cadilla gets US FDA approval for Mesalamine tablets…
Zydus Cadila, a group company of Cadilla Healthcare, has received US FDA
approval to market Mesalamine tablets in the US. Mesalamine is a generic version
of Lialda which is used extensively in the US to treat ulcerative colitis, which is an
inflammatory bowel condition and afflicts nearly 7 lakh people in the US. Cadilla
was the first to file for an Abbreviated New Drug Application (ANDA) for the
generic version of Lialda and the market size of the brand in the US is estimated to
be nearly $1.15 billion. With this approval coming through, Cadilla now has
nearly 115 approvals from the US FDA. According to our estimates the company
can add around US$60mn and US$20mn in sales and net profit respectively. We
maintain that the valuations of the company are rich and more than adequately
factoring in the positives well, and today’s up move in the stock should be used to
book profits.
Economic and Political News
Southwest monsoon may hit Maharashtra in next two days
Working on resolution of large NPA accounts, says RBI
RBI lowers inflation projection to 2-3.5% in first half FY18
Corporate News
Idea AGM on June 30 to decide MD Kapania's pay, raising `10,000cr
Apollo Hospitals aims at better occupancy to boost growth, as Q4 net dips
Power Finance Corp to borrow `70,000cr this fiscal
Market Outlook
June 8, 2017
Top Picks HHHHH
Market Cap
CMP
Target
Upside
Company
Rationale
(` Cr)
(`)
(`)
(%)
Strong growth in domestic business due to its leadership
in acute therapeutic segment. Alkem expects to launch
Alkem Laboratories
22,602
1,890
2,161
14.3
more products in USA, which bodes for its international
business.
We expect the company would report strong profitability
Asian Granito
1,190
396
447
13.0
owing to better product mix, higher B2C sales and
amalgamation synergy..
Favourable outlook for the AC industry to augur well for
Cooling products business which is out pacing the market
Blue Star
6,025
630
760
20.6
growth. EMPPAC division's profitability to improve once
operating environment turns around..
With a focus on the low and medium income (LMI)
consumer segment, the company has increased its
Dewan Housing Finance
13,520
431
520
20.5
presence in tier-II & III cities where the growth opportunity
is immense.
Loan growth is likely to pick up after a sluggish FY17.
Karur Vysya Bank
7,744
128
160
24.9
Lower credit cost will help in strong bottomline growth.
Increasing share of CASA will help in NIM improvement.
Economic recovery to have favourable impact on
advertising & circulation revenue growth. Further, the
Jagran Prakashan
6,059
185
225
21.4
acquisition of a radio business (Radio City) would also
boost the company's revenue growth.
High order book execution in EPC segment, rising B2C
KEI Industries
1,680
216
258
19.4
sales and higher exports to boost the revenues and
profitability
Speedier execution and speedier sales, strong revenue
Mahindra Lifespace
2,156
420
522
24.3
visibilty in short-to-long run, attractive valuations
Massive capacity expansion along with rail advantage at
Navkar Corporation
3,116
219
265
21.3
ICD as well CFS augurs well for the company
Market leadership in Hindi news genre and no.
2
viewership ranking in English news genre, exit from the
TV Today Network
1,623
272
344
26.4
radio business, and anticipated growth in ad spends by
corporates to benefit the stock.
Source: Company, Angel Research
Market Outlook
June 08, 2017
Key Upcoming Events
Global economic events release calendar
Date
Time
Country
Event Description
Unit
Period
Bloomberg Data
Last Reported Estimated
Jun 8, 2017
2:30PM
India
RBI Cash Reserve ratio
%
Jun 7
4.00
4.00
2:30PM
Euro Zone
Euro-Zone GDP s.a. (QoQ)
% Change
1Q F
0.50
0.50
2:00PM
UK
Industrial Production (YoY)
% Change
Apr
1.40
(0.30)
China
Exports YoY%
% Change
May
8.00
7.20
Jun 9, 2017
5:15PM
Euro Zone
ECB announces interest rates
%
Jun 8
--
--
7:00AM
China
Consumer Price Index (YoY)
% Change
May
1.20
1.50
Jun 12, 2017
5:30PM
India
Industrial Production YoY
% Change
Apr
2.70
--
Jun 13, 2017
2:00PM
UK
CPI (YoY)
% Change
May
2.70
--
US
Producer Price Index (mom)
% Change
May
0.60
--
Jun 14, 2017
India
Imports YoY%
% Change
May
49.10
--
India
Exports YoY%
% Change
May
19.80
--
2:00PM
UK
Jobless claims change
% Change
May
19.40
--
7:30AM
China
Industrial Production (YoY)
% Change
May
6.50
6.40
6:00PM
US
Consumer price index (mom)
% Change
May
0.20
--
11:30PM
US
FOMC rate decision
%
Jun 14
1.00
1.25
12:00PM
India
Monthly Wholesale Prices YoY%
% Change
May
3.85
--
Jun 15, 2017
6:45PM
US
Industrial Production
%
May
0.98
--
4:30PM
UK
BOE Announces rates
% Ratio
Jun 15
0.25
--
Jun 16, 2017
2:30PM
Euro Zone
Euro-Zone CPI (YoY)
%
May F
1.40
--
6:00PM
US
Housing Starts
Thousands
May
1,172.00
1,225.00
6:00PM
US
Building permits
Thousands
May
1,260.00
1,250.00
Jun 21, 2017
7:30PM
US
Existing home sales
Million
May
5.57
5.60
Jun 22, 2017
7:30PM
Euro Zone
Euro-Zone Consumer Confidence
Value
Jun A
(3.30)
--
Jun 23, 2017
1:00PM
Germany
PMI Services
Value
Jun P
55.40
--
7:30PM
US
New home sales
Thousands
May
569.00
600.00
7:30PM
US
Consumer Confidence
S.A./ 1985=100
Jun
117.90
--
Source: Bloomberg, Angel Research
Market Outlook
June 08, 2017
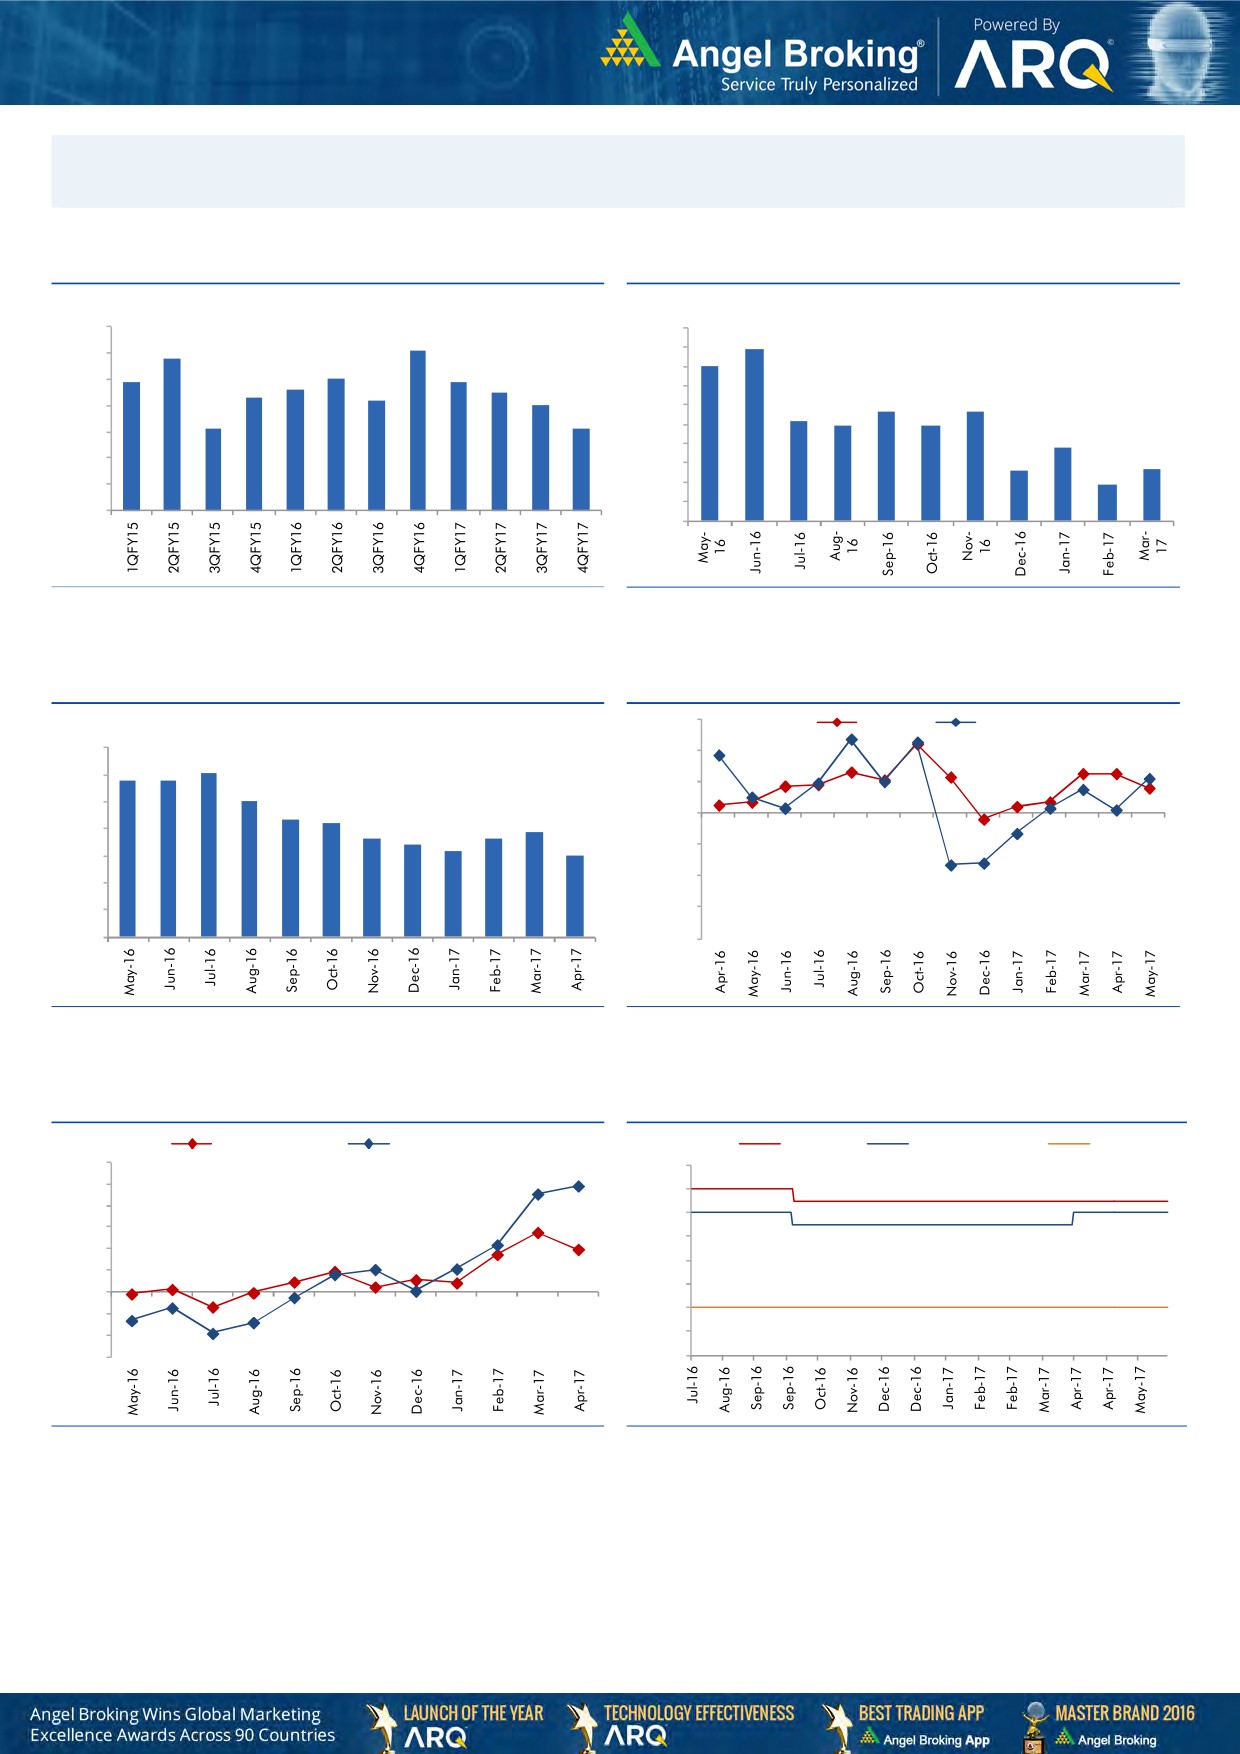
Macro watch
Exhibit 1: Quarterly GDP trends
Exhibit 2: IIP trends
(%)
(%)
10.0
10.0
9.1
8.9
8.8
9.0
8.0
9.0
7.9
8.0
7.9
8.0
7.6
7.5
8.0
7.3
7.2
7.0
7.0
5.7
5.7
7.0
6.0
5.2
4.9
4.9
6.1
6.1
5.0
6.0
3.8
4.0
2.6
2.7
5.0
3.0
1.9
4.0
2.0
1.0
3.0
-
Source: CSO, Angel Research
Source: MOSPI, Angel Research
Exhibit 3: Monthly CPI inflation trends
Exhibit 4: Manufacturing and services PMI
(%)
56.0
Mfg. PMI
Services PMI
7.0
54.0
6.1
5.8
5.8
6.0
5.1
52.0
5.0
4.3
4.2
3.9
50.0
3.6
3.7
4.0
3.4
3.2
3.0
48.0
3.0
46.0
2.0
1.0
44.0
-
42.0
Source: MOSPI, Angel Research
Source: Market, Angel Research; Note: Level above 50 indicates expansion
Exhibit 5: Exports and imports growth trends
Exhibit 6: Key policy rates
(%)
Exports yoy growth
Imports yoy growth
(%)
Repo rate
Reverse Repo rate
CRR
60.0
7.00
50.0
6.50
40.0
6.00
30.0
5.50
20.0
5.00
10.0
4.50
0.0
4.00
(10.0)
(20.0)
3.50
(30.0)
3.00
Source: Bloomberg, Angel Research
Source: RBI, Angel Research
Market Outlook
June 08, 2017
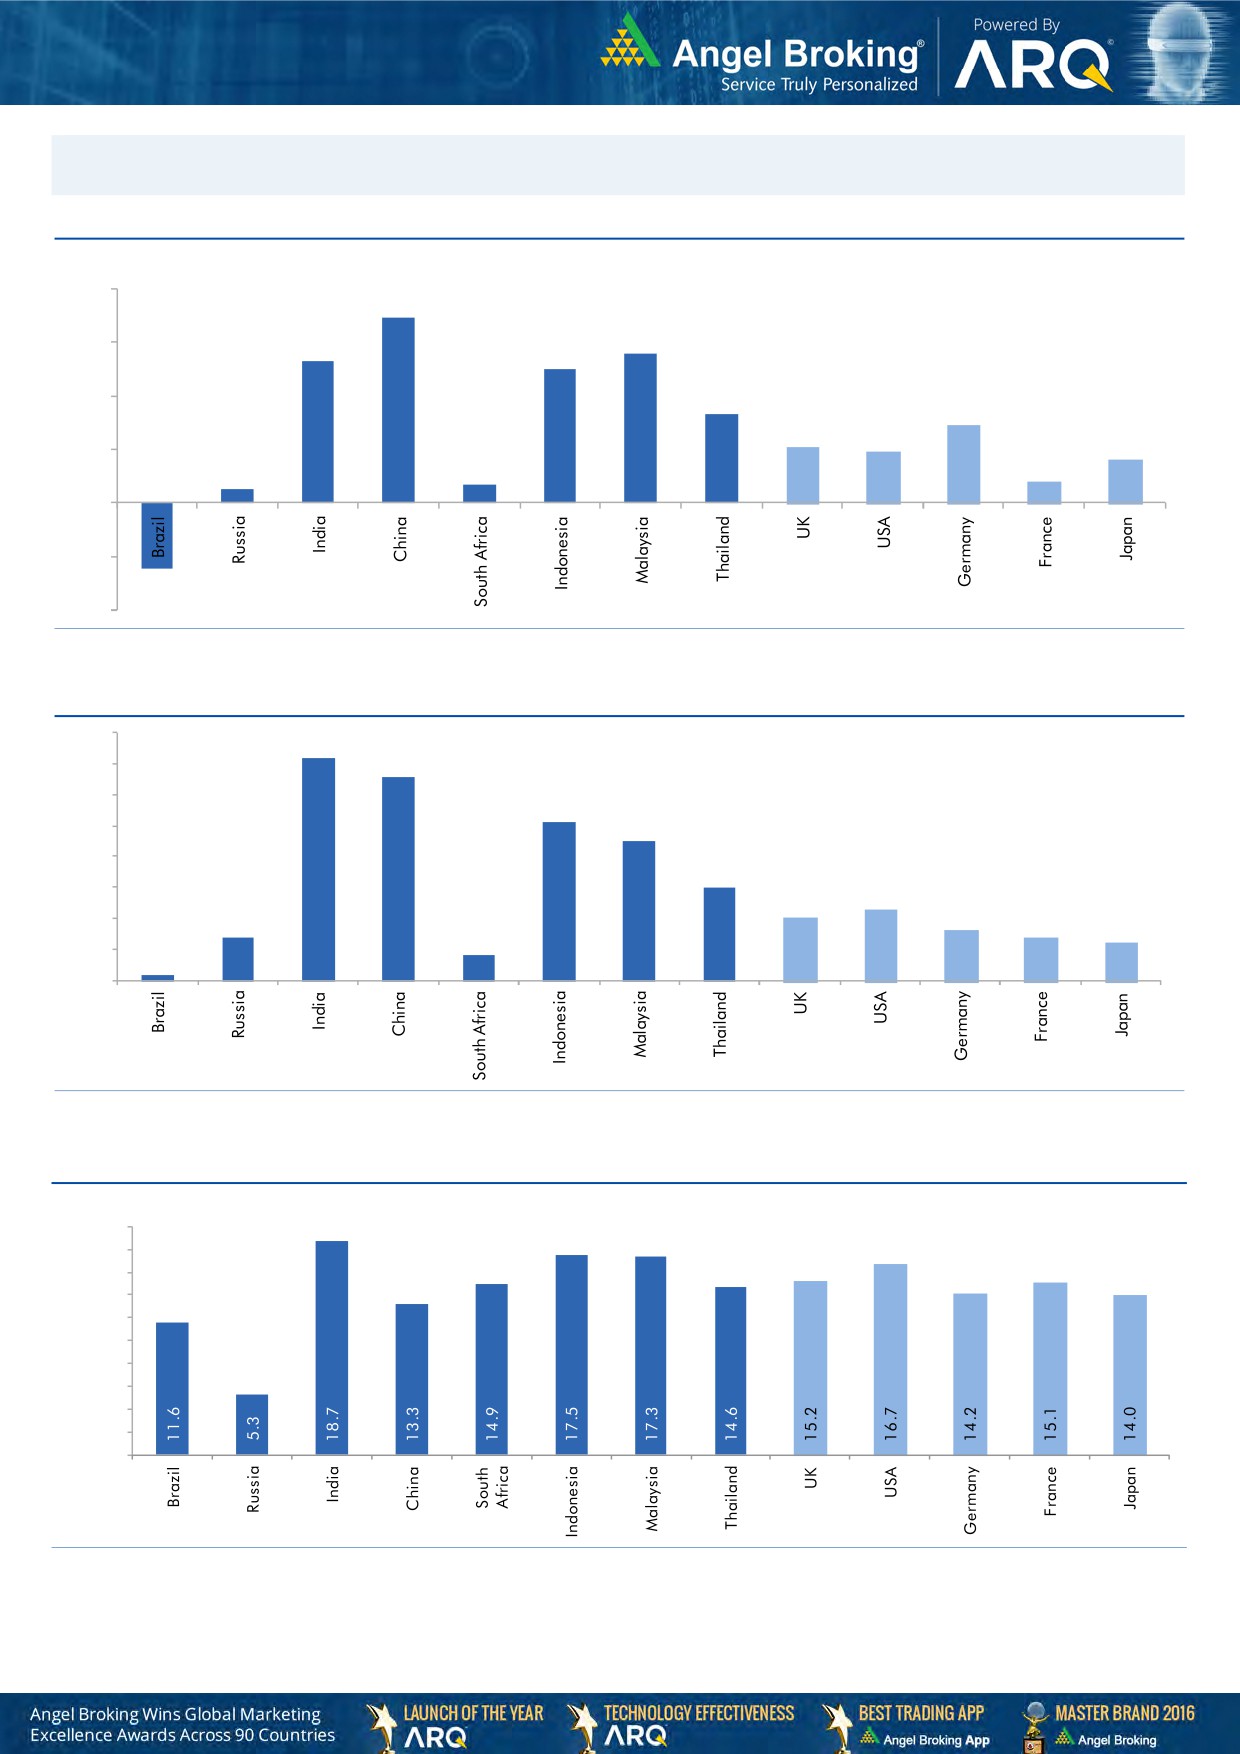
Global watch
Exhibit 1: Latest quarterly GDP Growth (%, yoy) across select developing and developed countries
(%)
8.0
6.9
5.6
6.0
5.3
5.0
0.7
4.0
3.3
2.9
2.1
1.9
0.5
2.0
1.6
0.8
-
(2.0)
(2.5)
(4.0)
Source: Bloomberg, Angel Research
Exhibit 2: 2016 GDP Growth projection by IMF (%, yoy) across select developing and developed countries
(%)
7.2
6.6
7.0
6.0
5.1
5.0
4.5
4.0
3.0
3.0
2.3
2.0
1.4
1.6
2.0
1.4
1.2
0.2
0.8
1.0
-
Source: IMF, Angel Research
Exhibit 3: One year forward P-E ratio across select developing and developed countries
(x)
20.0
18.0
16.0
14.0
12.0
10.0
8.0
6.0
4.0
2.0
-
Source: IMF, Angel Research
Market Outlook
June 08, 2017
Exhibit 4: Relative performance of indices across globe
Returns (%)
Country
Name of index
Closing price
1M
3M
1YR
Brazil
Bovespa
63,171
(3.6)
(4.8)
25.3
Russia
Micex
1,868
(6.5)
(9.2)
(3.4)
India
Nifty
9,664
3.8
8.6
17.6
China
Shanghai Composite
3,140
1.1
(2.6)
11.4
South Africa
Top 40
45,809
(2.7)
2.2
(4.7)
Mexico
Mexbol
49,275
(0.5)
3.9
6.5
Indonesia
LQ45
959
1.7
7.5
16.9
Malaysia
KLCI
1,786
1.3
3.3
9.8
Thailand
SET 50
988
(0.9)
0.2
8.4
USA
Dow Jones
21,174
0.8
1.2
17.6
UK
FTSE
7,479
2.5
1.4
20.0
Japan
Nikkei
19,985
0.4
2.6
16.0
Germany
DAX
12,672
(0.3)
5.4
31.2
France
CAC
5,266
(2.2)
5.9
26.2
Source: Bloomberg, Angel Research
Stock Watch
June 08, 2017
Company Name
Reco
CMP
Target
Mkt Cap
Sales ( Čcr )
OPM(%)
EPS (Č)
PER(x)
P/BV(x)
RoE(%)
EV/Sales(x)
(Č)
Price ( Č)
( Č cr )
FY17E
FY18E
FY17E
FY18E
FY17E
FY18E
FY17E
FY18E
FY17E
FY18E
FY17E
FY18E
FY17E
FY18E
Agri / Agri Chemical
Rallis
Neutral
248
-
4,815
1,937
2,164
13.3
14.3
9.0
11.0
27.5
22.5
4.8
4.2
18.4
19.8
2.5
2.2
United Phosphorus
Neutral
860
-
43,668
15,176
17,604
18.5
18.5
37.4
44.6
23.0
19.3
4.5
3.7
21.4
21.2
3.0
2.5
Auto & Auto Ancillary
Amara Raja Batteries
Buy
874
1,009
14,926
5,305
6,100
16.0
16.3
28.4
34.0
30.8
25.7
5.9
5.0
19.3
19.3
2.8
2.4
Apollo Tyres
Neutral
259
-
13,199
12,877
14,504
14.3
13.9
21.4
23.0
12.1
11.3
1.9
1.6
16.4
15.2
1.2
1.1
Ashok Leyland
Buy
93
111
26,410
20,021
21,915
11.6
11.9
4.5
5.3
20.6
17.4
4.2
3.7
20.6
21.5
1.3
1.1
Bajaj Auto
Neutral
2,873
-
83,147
25,093
27,891
19.5
19.2
143.9
162.5
20.0
17.7
5.6
4.8
30.3
29.4
3.0
2.7
Bharat Forge
Neutral
1,210
-
28,175
7,726
8,713
20.5
21.2
35.3
42.7
34.3
28.3
6.3
5.7
18.9
20.1
3.7
3.2
Ceat
Neutral
1,892
-
7,654
7,524
8,624
13.0
12.7
131.1
144.3
14.4
13.1
2.7
2.3
19.8
18.6
1.1
1.0
Eicher Motors
Neutral
29,621
-
80,635
16,583
20,447
17.5
18.0
598.0
745.2
49.5
39.8
16.9
12.9
41.2
38.3
4.7
3.7
Exide Industries
Neutral
224
-
19,010
7,439
8,307
15.0
15.0
8.1
9.3
27.6
24.1
3.9
3.5
14.3
16.7
2.2
1.9
Gabriel India
Neutral
139
-
1,995
1,544
1,715
9.0
9.3
5.4
6.3
25.7
22.0
4.9
4.3
18.9
19.5
1.2
1.1
Hero Motocorp
Neutral
3,844
-
76,764
28,083
30,096
15.3
15.7
171.8
187.0
22.4
20.6
7.8
6.6
30.1
27.9
2.6
2.3
Indag Rubber
Neutral
206
-
542
286
326
19.8
16.8
11.7
13.3
17.7
15.5
3.0
2.8
17.8
17.1
1.6
1.4
Jamna Auto Industries
Neutral
261
-
2,081
1,486
1,620
9.8
9.9
15.0
17.2
17.4
15.2
3.8
3.2
21.8
21.3
1.5
1.3
JK Tyres
Neutral
182
-
4,136
7,455
8,056
15.0
15.0
21.8
24.5
8.4
7.4
1.8
1.4
22.8
21.3
0.7
0.6
L G Balakrishnan & Bros Neutral
742
-
1,165
1,302
1,432
11.6
11.9
43.7
53.0
17.0
14.0
2.4
2.2
13.8
14.2
1.0
0.9
Mahindra and Mahindra Neutral
1,433
-
88,987
46,534
53,077
11.6
11.7
67.3
78.1
21.3
18.4
3.5
3.0
15.4
15.8
1.9
1.6
Maruti
Neutral
7,204
-
217,609
67,822
83,288
16.0
16.4
253.8
312.4
28.4
23.1
6.5
5.3
23.0
22.9
2.9
2.3
Minda Industries
Neutral
624
-
5,391
2,728
3,042
9.0
9.1
68.2
86.2
9.2
7.2
2.1
1.7
23.8
24.3
2.0
1.8
Motherson Sumi
Neutral
460
-
64,598
45,896
53,687
7.8
8.3
13.0
16.1
35.3
28.6
11.4
9.1
34.7
35.4
1.5
1.2
Rane Brake Lining
Neutral
1,333
-
1,055
511
562
11.3
11.5
28.1
30.9
47.4
43.1
7.2
6.6
15.3
15.0
2.2
2.0
Setco Automotive
Neutral
39
-
525
741
837
13.0
13.0
15.2
17.0
2.6
2.3
0.4
0.4
15.8
16.3
1.1
1.0
Subros
Neutral
268
-
1,606
1,488
1,681
11.7
11.9
6.4
7.2
41.8
37.4
4.4
4.0
10.8
11.4
1.3
1.1
Swaraj Engines
Neutral
1,945
-
2,416
660
810
15.2
16.4
54.5
72.8
35.7
26.7
11.1
10.1
31.5
39.2
3.5
2.8
Tata Motors
Neutral
458
-
132,226
300,209
338,549
8.9
8.4
42.7
54.3
10.7
8.4
1.7
1.5
15.6
17.2
0.6
0.5
TVS Motor
Neutral
536
-
25,472
13,390
15,948
6.9
7.1
12.8
16.5
42.0
32.4
10.5
8.3
26.3
27.2
1.9
1.6
Capital Goods
ACE
Neutral
65
-
640
709
814
4.1
4.6
1.4
2.1
46.2
30.8
1.9
1.8
4.4
6.0
1.1
0.9
BEML
Neutral
1,248
-
5,196
3,451
4,055
6.3
9.2
31.4
57.9
39.7
21.6
2.4
2.2
6.3
10.9
1.6
1.4
BGR Energy
Neutral
156
-
1,124
16,567
33,848
6.0
5.6
7.8
5.9
20.0
26.4
1.1
1.1
4.7
4.2
0.2
0.1
Stock Watch
June 08, 2017
Company Name
Reco
CMP
Target
Mkt Cap
Sales ( Čcr )
OPM(%)
EPS (Č)
PER(x)
P/BV(x)
RoE(%)
EV/Sales(x)
(Č)
Price ( Č)
( Č cr )
FY17E
FY18E
FY17E
FY18E
FY17E
FY18E
FY17E
FY18E
FY17E
FY18E
FY17E
FY18E
FY17E
FY18E
Capital Goods
Bharat Electronics
Neutral
172
-
38,318
8,137
9,169
16.8
17.2
58.7
62.5
2.9
2.7
0.5
0.4
44.6
46.3
3.7
3.3
BHEL
Neutral
138
-
33,667
28,797
34,742
-
2.8
2.3
6.9
59.8
19.9
1.0
1.0
1.3
4.8
0.8
0.6
Blue Star
Buy
630
760
6,025
4,283
5,077
5.9
7.3
14.9
22.1
42.3
28.5
8.2
6.9
20.4
26.4
1.5
1.2
CG Power and Industrial
Neutral
84
-
5,280
5,777
6,120
5.9
7.0
3.3
4.5
25.5
18.7
1.1
1.1
4.4
5.9
0.9
0.7
Solutions
Greaves Cotton
Neutral
156
-
3,819
1,755
1,881
16.8
16.9
7.8
8.5
20.1
18.4
4.0
3.7
20.6
20.9
1.9
1.7
Inox Wind
Neutral
140
-
3,106
5,605
6,267
15.7
16.4
24.8
30.0
5.6
4.7
1.6
1.2
25.9
24.4
0.6
0.5
KEC International
Neutral
266
-
6,837
9,294
10,186
7.9
8.1
9.9
11.9
26.9
22.4
3.9
3.4
15.6
16.3
1.0
0.9
KEI Industries
Buy
216
258
1,680
2,633
3,001
10.4
10.0
12.7
13.0
17.0
16.6
3.6
3.0
21.4
18.2
0.8
0.7
Thermax
Neutral
955
-
11,377
5,421
5,940
7.3
7.3
25.7
30.2
37.2
31.6
4.5
4.1
12.2
13.1
2.0
1.8
VATech Wabag
Neutral
672
-
3,668
3,136
3,845
8.9
9.1
26.0
35.9
25.9
18.7
3.2
2.8
13.4
15.9
1.1
0.9
Voltas
Neutral
483
-
15,993
6,511
7,514
7.9
8.7
12.9
16.3
37.5
29.7
6.7
5.9
16.7
18.5
2.2
1.9
Cement
ACC
Neutral
1,612
-
30,278
11,225
13,172
13.2
16.9
44.5
75.5
36.2
21.4
3.4
3.2
11.2
14.2
2.7
2.3
Ambuja Cements
Neutral
237
-
47,010
9,350
10,979
18.2
22.5
5.8
9.5
40.8
24.9
3.4
3.1
10.2
12.5
5.0
4.3
India Cements
Neutral
210
-
6,451
4,364
4,997
18.5
19.2
7.9
11.3
26.6
18.6
1.9
1.9
8.0
8.5
2.2
2.0
J K Lakshmi Cement
Neutral
487
-
5,735
2,913
3,412
14.5
19.5
7.5
22.5
65.0
21.7
4.0
3.4
12.5
18.0
2.6
2.1
JK Cement
Neutral
1,051
-
7,349
4,398
5,173
15.5
17.5
31.2
55.5
33.7
18.9
4.0
3.5
12.0
15.5
2.2
1.8
Orient Cement
Neutral
161
-
3,296
2,114
2,558
18.5
20.5
8.1
11.3
19.9
14.2
2.9
2.5
9.0
14.0
2.2
1.7
UltraTech Cement
Neutral
4,137
-
113,575
25,768
30,385
21.0
23.5
111.0
160.0
37.3
25.9
4.8
4.2
13.5
15.8
4.5
3.8
Construction
Engineers India
Neutral
155
-
10,448
1,725
1,935
16.0
19.1
11.4
13.9
13.6
11.2
1.9
1.8
13.4
15.3
5.0
4.5
Gujarat Pipavav Port
Neutral
144
-
6,978
705
788
52.2
51.7
5.0
5.6
28.9
25.8
2.9
2.6
11.2
11.2
9.6
8.1
ITNL
Neutral
100
-
3,286
8,946
10,017
31.0
31.6
8.1
9.1
12.3
11.0
0.5
0.5
4.2
5.0
3.7
3.4
KNR Constructions
Neutral
210
-
2,958
1,385
1,673
14.7
14.0
41.2
48.5
5.1
4.3
1.0
0.8
14.9
15.2
2.2
1.8
Larsen & Toubro
Neutral
1,788
-
166,853
111,017
124,908
11.0
11.0
61.1
66.7
29.3
26.8
3.5
3.3
13.1
12.9
2.5
2.3
MEP Infra
Neutral
98
-
1,594
1,877
1,943
30.6
29.8
3.0
4.2
32.7
23.4
15.8
10.7
0.6
0.6
2.2
2.0
Nagarjuna Const.
Neutral
87
-
4,839
8,842
9,775
9.1
8.8
5.3
6.4
16.4
13.6
1.3
1.2
8.2
9.1
0.7
0.6
NBCC
Neutral
201
-
18,081
7,428
9,549
7.9
8.6
8.2
11.0
24.5
18.3
1.2
1.0
28.2
28.7
2.1
1.6
PNC Infratech
Neutral
145
-
3,720
2,350
2,904
13.1
13.2
9.0
8.8
16.1
16.5
0.6
0.5
15.9
13.9
1.7
1.4
Power Mech Projects
Neutral
585
-
861
1,801
2,219
12.7
14.6
72.1
113.9
8.1
5.1
1.5
1.3
16.8
11.9
0.5
0.4
Sadbhav Engineering
Neutral
315
-
5,404
3,598
4,140
10.3
10.6
9.0
11.9
35.0
26.5
3.7
3.2
9.9
11.9
1.8
1.5
Stock Watch
June 08, 2017
Company Name
Reco
CMP
Target
Mkt Cap
Sales ( Čcr )
OPM(%)
EPS (Č)
PER(x)
P/BV(x)
RoE(%)
EV/Sales(x)
(Č)
Price ( Č)
( Č cr )
FY17E
FY18E
FY17E
FY18E
FY17E
FY18E
FY17E
FY18E
FY17E
FY18E
FY17E
FY18E
FY17E
FY18E
Construction
Simplex Infra
Neutral
516
-
2,552
6,829
7,954
10.5
10.5
31.4
37.4
16.4
13.8
1.7
1.6
9.9
13.4
0.8
0.7
SIPL
Neutral
110
-
3,889
1,036
1,252
65.5
66.2
(8.4)
(5.6)
4.1
4.7
(22.8)
(15.9)
12.0
10.0
Financials
Axis Bank
Accumulate
513
580
123,026
46,932
53,575
3.5
3.4
32.4
44.6
15.9
11.5
2.0
1.8
13.6
16.5
-
-
Bank of Baroda
Neutral
177
-
40,772
19,980
23,178
1.8
1.8
11.5
17.3
15.4
10.2
1.8
1.5
8.3
10.1
-
-
Can Fin Homes
Neutral
2,908
-
7,742
420
526
3.5
3.5
86.5
107.8
33.6
27.0
7.2
5.9
23.6
24.1
-
-
Canara Bank
Neutral
363
-
21,670
15,225
16,836
1.8
1.8
14.5
28.0
25.0
13.0
1.7
1.4
5.8
8.5
-
-
Cholamandalam Inv. &
Buy
1,043
1,230
16,299
2,012
2,317
6.3
6.3
42.7
53.6
24.4
19.5
3.9
3.3
16.9
18.3
-
-
Fin. Co.
Dewan Housing Finance Buy
431
520
13,520
2,225
2,688
2.9
2.9
29.7
34.6
14.5
12.5
2.3
1.5
16.1
14.8
-
-
Equitas Holdings
Buy
158
235
5,347
939
1,281
11.7
11.5
5.8
8.2
27.3
19.3
2.4
2.1
10.9
11.5
-
-
Federal Bank
Accumulate
115
125
19,846
8,259
8,995
3.0
3.0
4.3
5.6
26.7
20.5
2.3
2.1
8.5
10.1
-
-
HDFC
Neutral
1,598
-
253,918
11,475
13,450
3.4
3.4
45.3
52.5
35.3
30.4
6.8
6.0
20.2
20.5
-
-
HDFC Bank
Neutral
1,641
-
421,427
46,097
55,433
4.5
4.5
58.4
68.0
28.1
24.1
4.9
4.1
18.8
18.6
-
-
ICICI Bank
Neutral
325
-
189,262
42,800
44,686
3.1
3.3
18.0
21.9
18.0
14.8
2.4
2.3
11.1
12.3
-
-
Karur Vysya Bank
Buy
128
160
7,744
5,640
6,030
3.3
3.2
8.9
10.0
14.4
12.8
1.5
1.4
11.2
11.4
-
-
Lakshmi Vilas Bank
Neutral
187
-
3,585
3,339
3,799
2.7
2.8
11.0
14.0
17.0
13.4
1.8
1.6
11.2
12.7
-
-
LIC Housing Finance
Neutral
740
-
37,327
3,712
4,293
2.6
2.5
39.0
46.0
19.0
16.1
3.6
3.0
19.9
20.1
-
-
Punjab Natl.Bank
Neutral
152
-
32,356
23,532
23,595
2.3
2.4
6.8
12.6
22.4
12.1
3.5
2.5
3.3
6.5
-
-
RBL Bank
Neutral
549
-
20,668
1,783
2,309
2.6
2.6
12.7
16.4
43.3
33.5
4.7
4.2
12.8
13.3
-
-
Repco Home Finance
Neutral
786
-
4,917
388
457
4.5
4.2
30.0
38.0
26.2
20.7
4.4
3.7
18.0
19.2
-
-
South Ind.Bank
Neutral
28
-
5,113
6,435
7,578
2.5
2.5
2.7
3.1
10.5
9.2
1.4
1.1
10.1
11.2
-
-
St Bk of India
Neutral
291
-
235,794
88,650
98,335
2.6
2.6
13.5
18.8
21.5
15.5
2.1
1.8
7.0
8.5
-
-
Union Bank
Neutral
159
-
10,951
13,450
14,925
2.3
2.3
25.5
34.5
6.3
4.6
0.9
0.8
7.5
10.2
-
-
Yes Bank
Neutral
1,494
-
68,294
8,978
11,281
3.3
3.4
74.0
90.0
20.2
16.6
3.8
3.3
17.0
17.2
-
-
FMCG
Akzo Nobel India
Neutral
1,792
-
8,595
2,955
3,309
13.3
13.7
57.2
69.3
31.4
25.9
10.2
8.6
32.7
33.3
2.7
2.4
Asian Paints
Neutral
1,162
-
111,488
17,128
18,978
16.8
16.4
19.1
20.7
60.9
56.2
21.2
20.0
34.8
35.5
6.4
5.8
Britannia
Neutral
3,637
-
43,642
9,594
11,011
14.6
14.9
80.3
94.0
45.3
38.7
18.6
14.4
41.2
-
4.4
3.8
Colgate
Neutral
1,066
-
28,986
4,605
5,149
23.4
23.4
23.8
26.9
44.8
39.6
24.8
19.4
64.8
66.8
6.2
5.5
Dabur India
Accumulate
284
304
49,983
8,315
9,405
19.8
20.7
8.1
9.2
35.0
30.8
9.8
8.1
31.6
31.0
5.7
5.0
GlaxoSmith Con*
Neutral
5,350
-
22,500
4,350
4,823
21.2
21.4
179.2
196.5
29.9
27.2
7.9
6.7
27.1
26.8
4.6
4.0
Stock Watch
June 08, 2017
Company Name
Reco
CMP
Target
Mkt Cap
Sales ( Čcr )
OPM(%)
EPS (Č)
PER(x)
P/BV(x)
RoE(%)
EV/Sales(x)
(Č)
Price ( Č)
( Č cr )
FY17E FY18E
FY17E
FY18E
FY17E
FY18E
FY17E
FY18E
FY17E
FY18E
FY17E
FY18E
FY17E
FY18E
FMCG
Godrej Consumer
Neutral
1,862
-
63,423
10,235
11,428
18.4
18.6
41.1
44.2
45.3
42.1
10.1
8.5
24.9
24.8
6.3
5.6
HUL
Neutral
1,107
-
239,541
35,252
38,495
17.8
17.8
20.7
22.4
53.6
49.4
51.2
43.9
95.6
88.9
6.6
6.1
ITC
Neutral
312
-
379,241
40,059
44,439
38.3
39.2
9.0
10.1
34.8
30.8
9.7
8.5
27.8
27.5
9.0
8.1
Marico
Neutral
320
-
41,231
6,430
7,349
18.8
19.5
6.4
7.7
49.9
41.5
15.1
12.7
33.2
32.5
6.2
5.4
Nestle*
Neutral
6,668
-
64,291
10,073
11,807
20.7
21.5
124.8
154.2
53.4
43.2
21.9
19.7
34.8
36.7
6.2
5.3
Procter & Gamble
Neutral
7,898
-
25,637
2,939
3,342
23.2
23.0
146.2
163.7
54.0
48.3
13.7
11.4
25.3
23.5
8.3
7.2
Hygiene
Tata Global
Neutral
156
-
9,817
8,675
9,088
9.8
9.8
7.4
8.2
21.0
19.0
1.7
1.6
7.9
8.1
1.1
1.0
IT
HCL Tech^
Buy
878
1,014
125,332
46,723
52,342
22.1
20.9
60.0
62.8
14.6
14.0
3.7
3.1
25.3
22.4
2.4
2.1
Infosys
Buy
962
1,179
220,851
68,484
73,963
26.0
26.0
63.0
64.0
15.3
15.0
3.2
2.9
20.8
19.7
2.9
2.6
TCS
Neutral
2,615
-
515,336
117,966
127,403
27.5
27.6
134.3
144.5
19.5
18.1
5.8
5.4
29.8
29.7
4.0
3.7
Tech Mahindra
Buy
400
533
38,946
29,141
31,051
14.4
15.0
32.3
35.6
12.4
11.2
2.1
1.9
17.1
17.0
1.2
1.0
Wipro
Neutral
549
-
133,539
55,421
58,536
20.3
20.3
35.1
36.5
15.6
15.0
2.7
2.3
19.2
14.6
1.8
1.6
Media
D B Corp
Neutral
373
-
6,869
2,297
2,590
27.4
28.2
21.0
23.4
17.8
16.0
4.2
3.6
23.7
23.1
2.8
2.4
Hindustan Media
Neutral
275
-
2,019
1,016
1,138
24.3
25.2
27.3
30.1
10.1
9.1
1.9
1.7
16.2
15.8
1.3
1.1
Ventures
HT Media
Neutral
83
-
1,925
2,693
2,991
12.6
12.9
7.9
9.0
10.5
9.2
0.9
0.8
7.8
8.3
0.3
0.2
Jagran Prakashan
Buy
185
225
6,059
2,283
2,555
28.0
28.0
10.6
12.3
17.4
15.1
3.7
3.2
21.4
21.4
2.7
2.3
Sun TV Network
Neutral
823
-
32,445
2,850
3,265
70.1
71.0
26.2
30.4
31.4
27.1
8.0
7.1
24.3
25.6
11.0
9.4
TV Today Network
Buy
272
344
1,623
608
667
21.5
22.3
15.7
19.2
17.4
14.1
2.6
2.3
16.1
16.0
2.3
2.0
Metals & Mining
Coal India
Neutral
264
-
163,845
84,638
94,297
21.4
22.3
24.5
27.1
10.8
9.7
4.5
4.3
42.6
46.0
1.4
1.3
Hind. Zinc
Neutral
233
-
98,387
14,252
18,465
55.9
48.3
15.8
21.5
14.7
10.8
2.4
2.1
17.0
20.7
6.9
5.3
Hindalco
Neutral
197
-
44,261
107,899
112,095
7.4
8.2
9.2
13.0
21.5
15.2
1.0
1.0
4.8
6.6
0.9
0.9
JSW Steel
Neutral
195
-
47,208
53,201
58,779
16.1
16.2
130.6
153.7
1.5
1.3
0.2
0.2
14.0
14.4
1.6
1.4
NMDC
Neutral
116
-
36,559
6,643
7,284
44.4
47.7
7.1
7.7
16.3
15.0
1.4
1.4
8.8
9.2
3.3
2.9
SAIL
Neutral
57
-
23,542
47,528
53,738
(0.7)
2.1
(1.9)
2.6
21.9
0.6
0.6
(1.6)
3.9
1.3
1.2
Tata Steel
Neutral
491
-
47,692
121,374
121,856
7.2
8.4
18.6
34.3
26.4
14.3
1.7
1.5
6.1
10.1
1.0
1.0
Vedanta
Neutral
233
-
86,685
71,744
81,944
19.2
21.7
13.4
20.1
17.4
11.6
1.5
1.3
8.4
11.3
1.6
1.3
Oil & Gas
GAIL
Neutral
403
-
68,083
56,220
65,198
9.3
10.1
27.1
33.3
14.9
12.1
1.4
1.3
9.3
10.7
1.4
1.2
Indian Oil Corp
Neutral
427
-
207,517
373,359
428,656
5.9
5.5
54.0
59.3
7.9
7.2
1.2
1.1
16.0
15.6
0.7
0.6
ONGC
Neutral
172
-
221,309
137,222
152,563
15.0
21.8
19.5
24.1
8.8
7.2
0.8
0.7
8.5
10.1
1.9
1.7
Stock Watch
June 08, 2017
Company Name
Reco
CMP
Target
Mkt Cap
Sales ( Čcr )
OPM(%)
EPS (Č)
PER(x)
P/BV(x)
RoE(%)
EV/Sales(x)
(Č)
Price ( Č)
( Č cr )
FY17E FY18E
FY17E
FY18E
FY17E
FY18E
FY17E
FY18E
FY17E
FY18E
FY17E
FY18E
FY17E
FY18E
Oil & Gas
Reliance Industries
Neutral
1,339
-
435,432
301,963
358,039
12.1
12.6
87.7
101.7
15.3
13.2
1.6
1.4
10.7
11.3
1.9
1.6
Pharmaceuticals
Alembic Pharma
Buy
553
648
10,422
3,101
3,966
19.7
20.5
21.4
25.5
25.8
21.7
5.5
4.5
23.0
22.8
3.3
2.5
Alkem Laboratories Ltd
Accumulate
1,890
2,161
22,602
5,853
6,901
17.1
18.4
74.6
85.0
25.3
22.2
5.4
4.5
21.1
20.2
3.8
3.3
Aurobindo Pharma
Buy
598
823
35,039
14,845
17,086
21.5
22.1
39.4
44.7
15.2
13.4
3.7
3.0
27.6
24.7
2.5
2.2
Aventis*
Neutral
4,076
-
9,387
2,206
2,508
16.6
16.8
128.9
139.9
31.6
29.1
5.4
4.2
21.6
23.5
4.0
3.4
Cadila Healthcare
Neutral
537
-
55,001
9,220
11,584
18.4
20.3
14.5
18.7
37.1
28.7
7.9
6.4
23.5
24.6
6.3
4.8
Cipla
Reduce
539
465
43,398
15,378
18,089
15.7
16.8
19.3
24.5
28.0
22.0
3.3
2.9
12.3
13.9
3.0
2.5
Dishman Pharma
Sell
301
143
4,859
1,718
1,890
22.7
22.8
9.5
11.3
31.7
26.6
3.1
2.8
10.1
10.9
3.3
2.9
Dr Reddy's
Neutral
2,541
-
42,097
14,081
15,937
16.1
18.6
72.6
105.9
35.0
24.0
3.4
3.1
9.6
13.6
3.2
2.8
GSK Pharma*
Neutral
2,448
-
20,738
2,927
3,290
11.8
16.2
34.4
49.6
71.2
49.4
10.3
10.7
13.9
21.3
6.9
6.2
Indoco Remedies
Buy
196
240
1,802
1,112
1,289
16.2
18.2
11.6
16.0
16.9
12.2
2.7
2.3
17.0
20.1
1.7
1.4
Ipca labs
Buy
505
613
6,372
3,258
3,747
12.8
15.3
12.1
19.2
41.7
26.3
2.6
2.4
6.4
9.5
2.1
1.8
Lupin
Buy
1,154
1,809
52,129
15,912
18,644
26.4
26.7
58.1
69.3
19.9
16.7
3.9
3.2
21.4
20.9
3.4
2.7
Natco Pharma
Accumulate
995
1,060
17,350
2,065
1,988
33.1
33.7
27.9
25.7
35.7
38.7
10.4
8.9
29.2
22.9
8.5
8.6
Sun Pharma
Buy
511
847
122,637
31,129
35,258
32.0
32.9
30.2
35.3
16.9
14.5
2.8
2.3
20.0
20.1
3.5
2.9
Power
NTPC
Neutral
158
-
130,155
86,605
95,545
17.5
20.8
11.8
13.4
13.4
11.8
1.4
1.3
10.5
11.1
2.8
2.8
Power Grid
Accumulate
205
223
107,169
25,315
29,193
88.2
88.7
14.2
17.2
14.5
11.9
2.2
1.9
15.2
16.1
8.9
8.0
Tata Power
Neutral
80
-
21,638
36,916
39,557
17.4
27.1
5.1
6.3
15.7
12.7
1.4
1.3
9.0
10.3
1.6
1.4
Real Estate
MLIFE
Buy
420
522
2,156
1,152
1,300
22.7
24.6
29.9
35.8
14.1
11.7
1.0
1.0
7.6
8.6
2.6
2.2
Prestige Estate
Neutral
247
-
9,278
4,707
5,105
25.2
26.0
10.3
13.0
24.0
19.0
1.9
1.8
10.3
10.2
3.1
2.8
Telecom
Bharti Airtel
Neutral
373
-
148,983
105,086
114,808
34.5
34.7
12.2
16.4
30.6
22.7
2.1
1.9
6.8
8.4
2.3
2.0
Idea Cellular
Neutral
79
-
28,432
40,133
43,731
37.2
37.1
6.4
6.5
12.3
12.1
1.0
1.0
8.2
7.6
1.7
1.5
zOthers
Abbott India
Neutral
4,207
-
8,939
3,153
3,583
14.1
14.4
152.2
182.7
27.6
23.0
135.7
115.9
25.6
26.1
2.5
2.2
Asian Granito
Accumulate
396
447
1,190
1,066
1,169
11.6
12.5
13.0
16.0
30.4
24.8
3.0
2.7
9.5
10.7
1.4
1.3
Bajaj Electricals
Accumulate
358
395
3,629
4,801
5,351
5.7
6.2
10.4
13.7
34.4
26.2
4.3
3.8
12.4
14.5
0.8
0.7
Banco Products (India)
Neutral
224
-
1,600
1,353
1,471
12.3
12.4
14.5
16.3
15.4
13.7
21.3
19.2
14.5
14.6
1.1
120.7
Coffee Day Enterprises
Neutral
246
-
5,070
2,964
3,260
20.5
21.2
4.7
8.0
-
30.8
2.8
2.6
5.5
8.5
2.1
1.9
Ltd
Competent Automobiles Neutral
200
-
128
1,137
1,256
3.1
2.7
28.0
23.6
7.1
8.5
38.4
34.7
14.3
11.5
0.1
0.1
Elecon Engineering
Neutral
62
-
698
1,482
1,660
13.7
14.5
3.9
5.8
16.0
10.7
3.8
3.4
7.8
10.9
0.8
0.7
Stock Watch
June 08, 2017
Company Name
Reco
CMP
Target
Mkt Cap
Sales ( Čcr )
OPM(%)
EPS (Č)
PER(x)
P/BV(x)
RoE(%)
EV/Sales(x)
(Č)
Price ( Č)
( Č cr )
FY17E
FY18E
FY17E
FY18E
FY17E
FY18E
FY17E
FY18E
FY17E
FY18E
FY17E
FY18E
FY17E
FY18E
zOthers
Finolex Cables
Neutral
512
-
7,830
2,883
3,115
12.0
12.1
14.2
18.6
36.1
27.5
19.2
16.8
15.8
14.6
2.4
2.2
Garware Wall Ropes
Neutral
800
-
1,750
863
928
15.1
15.2
36.4
39.4
22.0
20.3
4.0
3.4
17.5
15.9
1.9
1.8
Goodyear India*
Neutral
875
-
2,017
1,598
1,704
10.4
10.2
49.4
52.6
17.7
16.6
81.7
71.7
18.2
17.0
0.9
135.0
Hitachi
Neutral
2,066
-
5,618
2,081
2,433
8.8
8.9
33.4
39.9
61.9
51.8
49.9
41.6
22.1
21.4
2.7
2.3
HSIL
Neutral
345
-
2,497
2,384
2,515
15.8
16.3
15.3
19.4
22.6
17.8
22.4
19.3
7.8
9.3
1.2
1.1
Interglobe Aviation
Neutral
1,128
-
40,783
21,122
26,005
14.5
27.6
110.7
132.1
10.2
8.5
61.0
43.6
168.5
201.1
1.9
1.5
Jyothy Laboratories
Neutral
376
-
6,831
1,440
2,052
11.5
13.0
8.5
10.0
44.2
37.6
10.7
9.9
18.6
19.3
5.0
3.5
Kirloskar Engines India
Neutral
381
-
5,505
2,554
2,800
9.9
10.0
10.5
12.1
36.3
31.5
15.2
14.3
10.7
11.7
1.8
1.6
Ltd
Linc Pen & Plastics
Neutral
263
-
389
382
420
9.3
9.5
13.5
15.7
19.5
16.7
3.3
2.9
17.1
17.3
1.1
1.0
M M Forgings
Neutral
616
-
744
546
608
20.4
20.7
41.3
48.7
14.9
12.6
84.4
74.7
16.6
17.0
1.2
1.1
Manpasand Bever.
Neutral
774
-
4,431
836
1,087
19.6
19.4
16.9
23.8
45.8
32.5
5.5
4.8
12.0
14.8
5.0
3.8
Mirza International
Neutral
140
-
1,687
963
1,069
17.2
18.0
6.1
7.5
22.9
18.7
3.5
3.0
15.0
15.7
2.0
1.8
MT Educare
Neutral
64
-
255
366
417
17.7
18.2
9.4
10.8
6.9
5.9
1.5
1.3
22.2
22.3
0.6
0.5
Narayana Hrudaya
Neutral
316
-
6,453
1,873
2,166
11.5
11.7
2.6
4.0
119.4
79.6
7.3
6.6
6.1
8.3
3.5
3.1
Navkar Corporation
Buy
219
265
3,116
347
371
43.2
37.3
6.7
6.0
32.8
36.4
2.3
2.0
6.2
10.6
10.1
9.4
Navneet Education
Neutral
188
-
4,385
1,062
1,147
24.0
24.0
6.1
6.6
30.8
28.3
6.3
5.6
20.6
19.8
4.2
3.9
Nilkamal
Neutral
2,043
-
3,048
1,995
2,165
10.7
10.4
69.8
80.6
29.3
25.3
116.7
101.4
16.6
16.5
1.5
1.4
Page Industries
Neutral
14,869
-
16,585
2,450
3,124
20.1
17.6
299.0
310.0
49.7
48.0
331.2
252.8
47.1
87.5
6.8
5.4
Parag Milk Foods
Neutral
232
-
1,953
1,919
2,231
9.3
9.6
9.5
12.9
24.6
18.0
3.8
3.2
15.5
17.5
1.2
1.0
Quick Heal
Neutral
213
-
1,492
408
495
27.3
27.0
7.7
8.8
27.5
24.2
2.6
2.6
9.3
10.6
2.8
2.3
Radico Khaitan
Buy
124
147
1,643
1,667
1,824
13.0
13.2
6.7
8.2
18.6
15.1
1.7
1.5
9.0
10.2
1.4
1.2
Relaxo Footwears
Neutral
491
-
5,903
2,085
2,469
9.2
8.2
7.6
8.0
65.0
61.8
25.2
21.5
17.9
18.8
2.9
2.5
S H Kelkar & Co.
Neutral
287
-
4,157
1,036
1,160
15.1
15.0
6.1
7.2
47.1
40.1
5.0
4.6
10.7
11.5
3.9
3.4
Siyaram Silk Mills
Accumulate
2,175
2,376
2,039
1,574
1,769
12.5
12.7
97.1
113.1
22.4
19.2
3.4
3.0
15.4
15.5
1.5
1.3
Styrolution ABS India*
Neutral
775
-
1,362
1,440
1,537
9.2
9.0
40.6
42.6
19.1
18.2
48.7
44.3
12.3
11.6
0.9
0.8
Surya Roshni
Neutral
290
-
1,271
3,342
3,625
7.8
7.5
17.3
19.8
16.8
14.7
31.9
25.6
10.5
10.8
0.6
0.6
Team Lease Serv.
Neutral
1,235
-
2,112
3,229
4,001
1.5
1.8
22.8
32.8
54.2
37.6
5.8
5.0
10.7
13.4
0.6
0.4
The Byke Hospitality
Neutral
190
-
762
287
384
20.5
20.5
7.6
10.7
25.0
17.8
5.2
4.2
20.7
23.5
2.7
2.0
Transport Corporation of
Neutral
322
-
2,468
2,671
2,911
8.5
8.8
13.9
15.7
23.3
20.6
3.2
2.8
13.7
13.8
1.0
0.9
India
Stock Watch
June 08, 2017
Company Name
Reco
CMP
Target Mkt Cap
Sales ( Čcr )
OPM(%)
EPS (Č)
PER(x)
P/BV(x)
RoE(%)
EV/Sales(x)
(Č)
Price ( Č)
( Č cr )
FY17E FY18E FY17E FY18E FY17E FY18E FY17E FY18E FY17E FY18E FY17E FY18E FY17E FY18E
zOthers
TVS Srichakra
Neutral
4,130
-
3,162
2,304
2,614
13.7
13.8
231.1
266.6
17.9
15.5
464.0
365.4
33.9
29.3
1.4
1.2
UFO Moviez
Neutral
381
-
1,051
619
685
33.2
33.4
30.0
34.9
12.7
10.9
1.8
1.5
13.8
13.9
1.4
1.1
Visaka Industries
Neutral
452
-
718
1,051
1,138
10.3
10.4
21.0
23.1
21.5
19.5
58.0
54.3
9.0
9.2
0.9
0.9
VRL Logistics
Neutral
324
-
2,952
1,902
2,119
16.7
16.6
14.6
16.8
22.2
19.2
4.9
4.3
21.9
22.2
1.7
1.5
Wonderla Holidays
Neutral
368
-
2,078
287
355
38.0
40.0
11.3
14.2
32.5
25.9
4.7
4.1
21.4
23.9
6.9
5.6
VIP Industries
Accumulate
194
218
2,745
1,270
1,450
10.4
10.4
5.6
6.5
34.7
29.9
7.2
6.3
20.7
21.1
2.2
1.9
Navin Fluorine
Buy
3,139
3,650
3,074
789
945
21.1
22.4
120.1
143.4
26.1
21.9
4.2
3.6
17.8
18.5
3.8
3.1
Source: Company, Angel Research; Note: *December year end; #September year end; &October year end; Price as on June 07, 2017
Market Outlook
June 08, 2017
Research Team Tel: 022 - 39357800
DISCLAIMER
Angel Broking Private Limited (hereinafter referred to as “Angel”) is a registered Member of National Stock Exchange of India
Limited,Bombay Stock Exchange Limited and Metropolitan Stock Exchange Limited. It is also registered as a Depository Participant with
CDSL and Portfolio Manager with SEBI. It also has registration with AMFI as a Mutual Fund Distributor. Angel Broking Private Limited is a
registered entity with SEBI for Research Analyst in terms of SEBI (Research Analyst) Regulations, 2014 vide registration number
INH000000164. Angel or its associates has not been debarred/ suspended by SEBI or any other regulatory authority for accessing
/dealing in securities Market. Angel or its associates/analyst has not received any compensation / managed or
co-managed public offering of securities of the company covered by Analyst during the past twelve months.
This document is solely for the personal information of the recipient, and must not be singularly used as the basis of any investment
decision. Nothing in this document should be construed as investment or financial advice. Each recipient of this document should make
such investigations as they deem necessary to arrive at an independent evaluation of an investment in the securities of the companies
referred to in this document (including the merits and risks involved), and should consult their own advisors to determine the merits and
risks of such an investment.
Reports based on technical and derivative analysis center on studying charts of a stock's price movement, outstanding positions and
trading volume, as opposed to focusing on a company's fundamentals and, as such, may not match with a report on a company's
fundamentals. Investors are advised to refer the Fundamental and Technical Research Reports available on our website to evaluate the
contrary view, if any.
The information in this document has been printed on the basis of publicly available information, internal data and other reliable
sources believed to be true, but we do not represent that it is accurate or complete and it should not be relied on as such, as this
document is for general guidance only. Angel Broking Pvt. Limited or any of its affiliates/ group companies shall not be in any way
responsible for any loss or damage that may arise to any person from any inadvertent error in the information contained in this report.
Angel Broking Pvt. Limited has not independently verified all the information contained within this document. Accordingly, we cannot
testify, nor make any representation or warranty, express or implied, to the accuracy, contents or data contained within this document.
While Angel Broking Pvt. Limited endeavors to update on a reasonable basis the information discussed in this material, there may be
regulatory, compliance, or other reasons that prevent us from doing so.
This document is being supplied to you solely for your information, and its contents, information or data may not be reproduced,
redistributed or passed on, directly or indirectly.
Neither Angel Broking Pvt. Limited, nor its directors, employees or affiliates shall be liable for any loss or damage that may arise from
or in connection with the use of this information.